
Exploratory Data Analysis (EDA) is an approach to analyzing data that involves summarizing and visualizing the main characteristics of the data in order to gain insights and identify patterns. To perform EDA on Twitter data related to supplement intake, you could start by collecting a dataset of tweets that mention supplements. You could use a Twitter API to search for tweets containing keywords related to supplements, or you could use a pre-existing dataset of tweets that have been collected and labeled for sentiment analysis. Once you have your dataset, you could start by cleaning and preprocessing the data to remove any irrelevant information or noise, such as retweets or spam messages.
Data Gathering
The data is collected from last 3 months tweets.
Used the following code to extract tweets and the required topic.
Link to the code: Extract Twitter Data
Link to the Dataset:Dataset
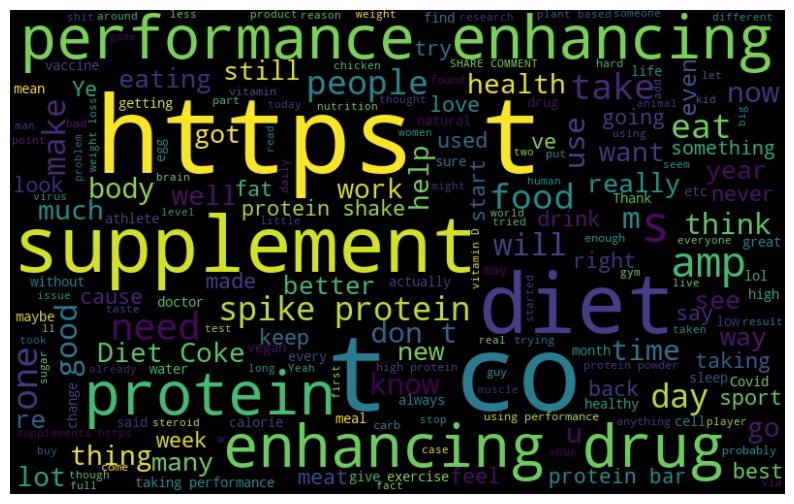
Word Cloud: Raw data
The word cloud visualization can provide a quick and intuitive way to understand the most commonly used words and phrases in tweets related to supplement intake and the sentiments associated with them. The larger the word appears in the cloud, the more frequently it appears in the tweets.
In this dataset,
Data cleaning and preprocessing usually involves removing duplicates, filtering out non-relevant words or phrases, removing punctuation marks, stop words, and special characters, and converting all text to lowercase, among other techniques. Once the dataset has been cleaned and preprocessed, you can generate a more accurate word cloud that better represents the main characteristics and patterns in the data.
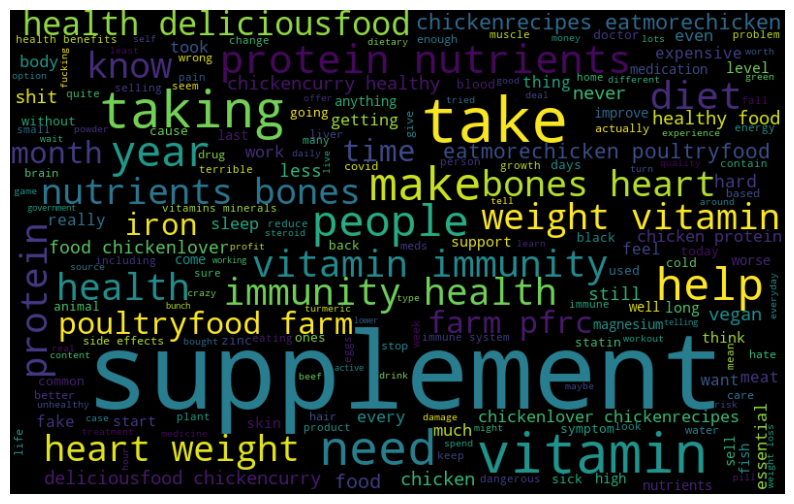
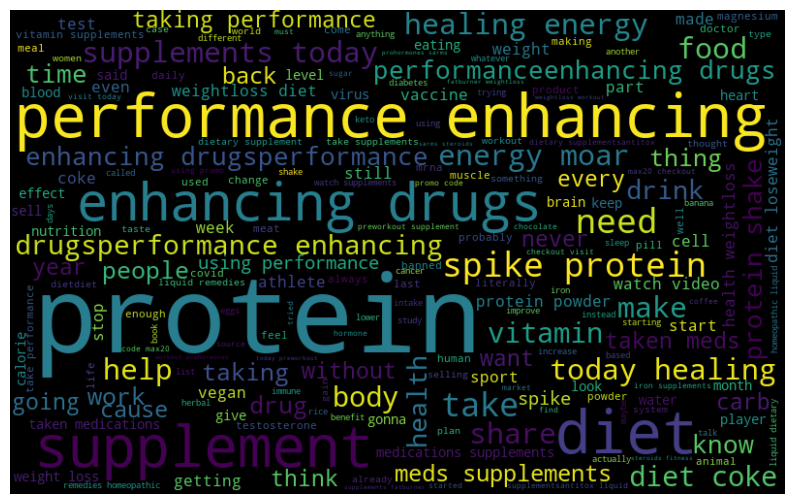
Word Clouds for Positive, Negative and cleaned dataset
For the given dataset, in the case of sentiment analysis on supplement intake, the word cloud for positive sentiment might include words like "benefits", "healthy", "boost", "improve", and "nutrition", while the word cloud for negative sentiment might include words like "dangerous", "unsafe", "fake", "scam", and "waste". The word cloud for neutral sentiment might include words like "supplement", "intake", "health", and "nutrition" that do not strongly convey positive or negative sentiment. By analyzing the word clouds, we can get a sense of the most commonly used words and phrases in tweets related to supplement intake and the sentiments associated with them. This information can help us understand the general sentiment towards supplement intake on Twitter and can inform marketing campaigns and public health policies related to supplement use.
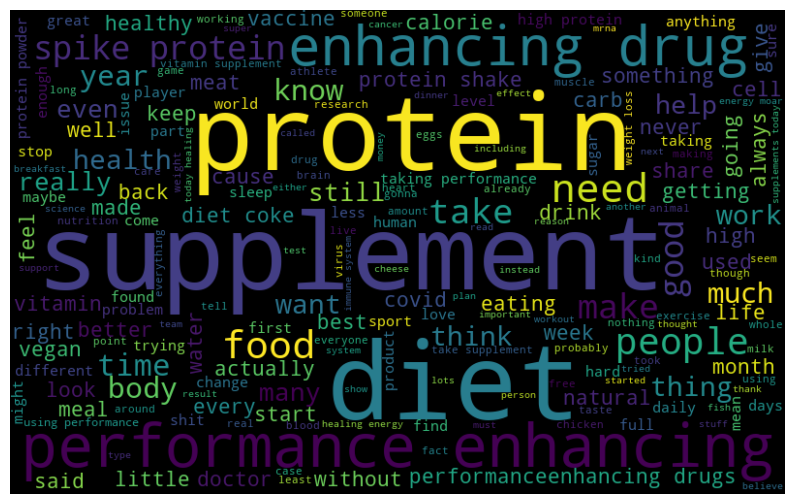
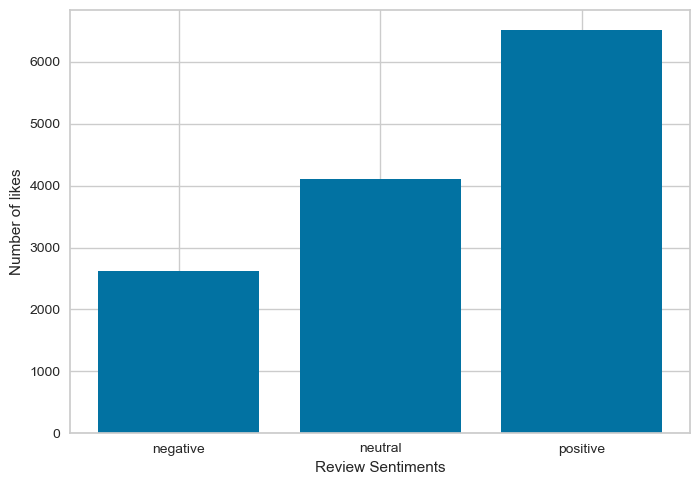
Following show the word cloud for cleaned tweets and also the distribution of positive, negative and neutral tweets which shows the seentiments associated with the supplement intake.
Graphs showing distribution of words, characters in tweets.
The graphs for text length, word count, top 30 words, and character length can provide valuable insights into the characteristics and patterns of the Twitter data related to supplement intake. Here's what each graph can tell us:
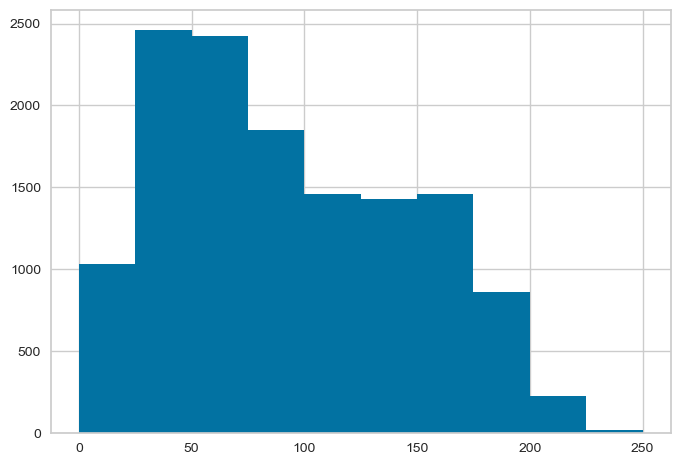
Text length: This graph shows the distribution of tweet lengths in the dataset. The X-axis represents the number of characters in the tweet, and the Y-axis represents the frequency of tweets with that number of characters. By analyzing this graph, we can identify the typical length of tweets related to supplement intake, which can help inform our understanding of how people communicate about this topic on Twitter.
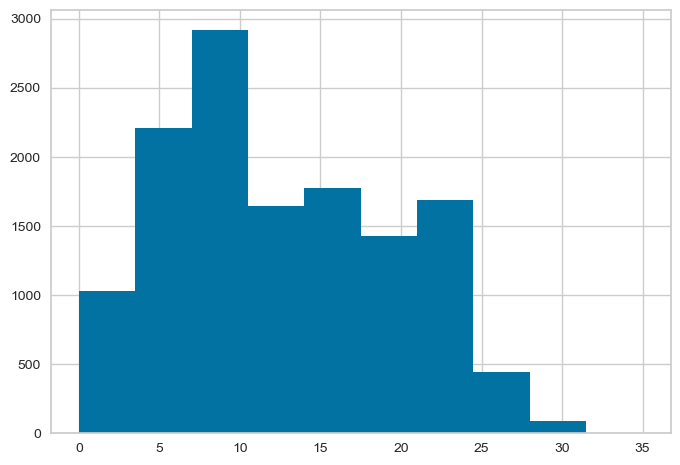
Word count: This graph shows the distribution of word counts in the dataset. The X-axis represents the number of words in the tweet, and the Y-axis represents the frequency of tweets with that number of words. By analyzing this graph, we can identify the typical number of words used in tweets related to supplement intake, which can help inform our understanding of how much information people typically share about this topic on Twitter.
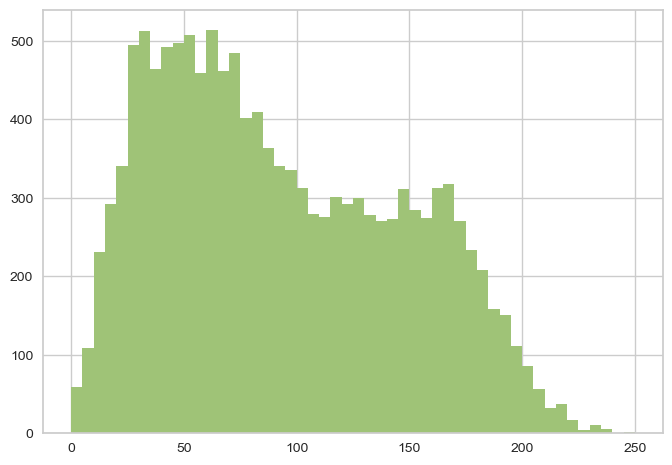
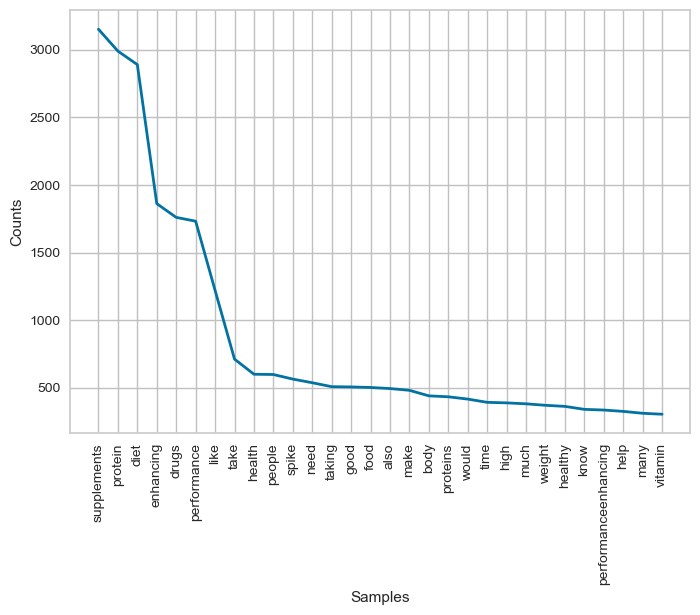
Top 30 words: This graph shows the 30 most commonly used words in the dataset, along with their frequency of occurrence. By analyzing this graph, we can identify the most common words and phrases used in tweets related to supplement intake, which can help inform our understanding of the main topics and themes associated with this topic on Twitter. Character length: This graph shows the distribution of character lengths of the top 30 most common words in the dataset. The X-axis represents the number of characters in the word, and the Y-axis represents the frequency of occurrence of words with that number of characters. By analyzing this graph, we can identify the typical length of the most commonly used words in tweets related to supplement intake, which can help inform our understanding of how people communicate about this topic on Twitter.
Overall, these graphs can provide valuable insights into the characteristics and patterns of the Twitter data related to supplement intake, which can help inform marketing campaigns, public health policies, and other initiatives related to this topic.