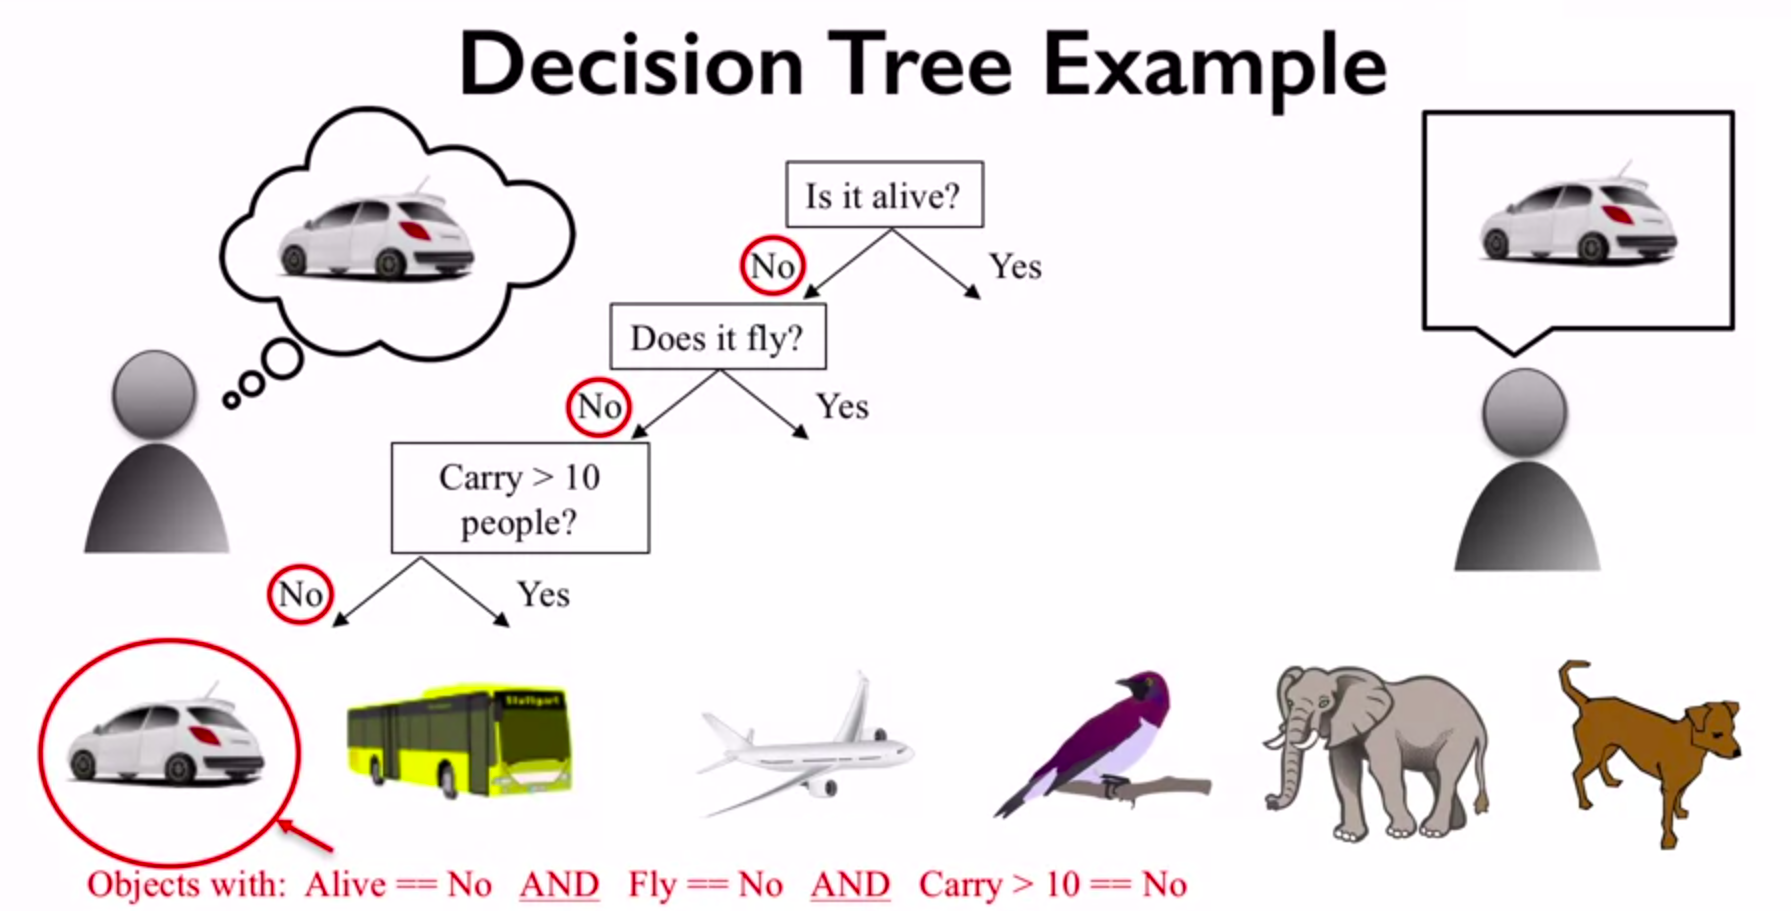
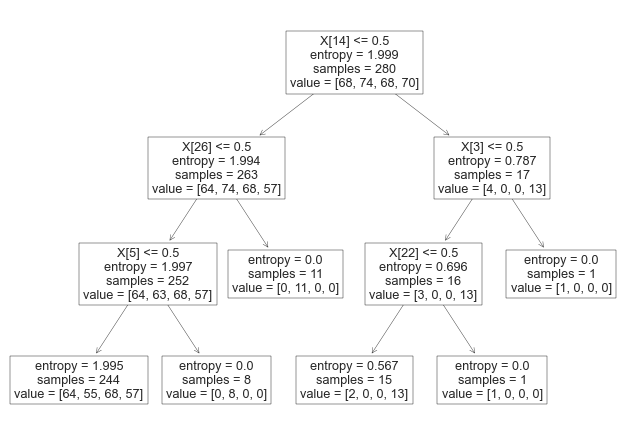
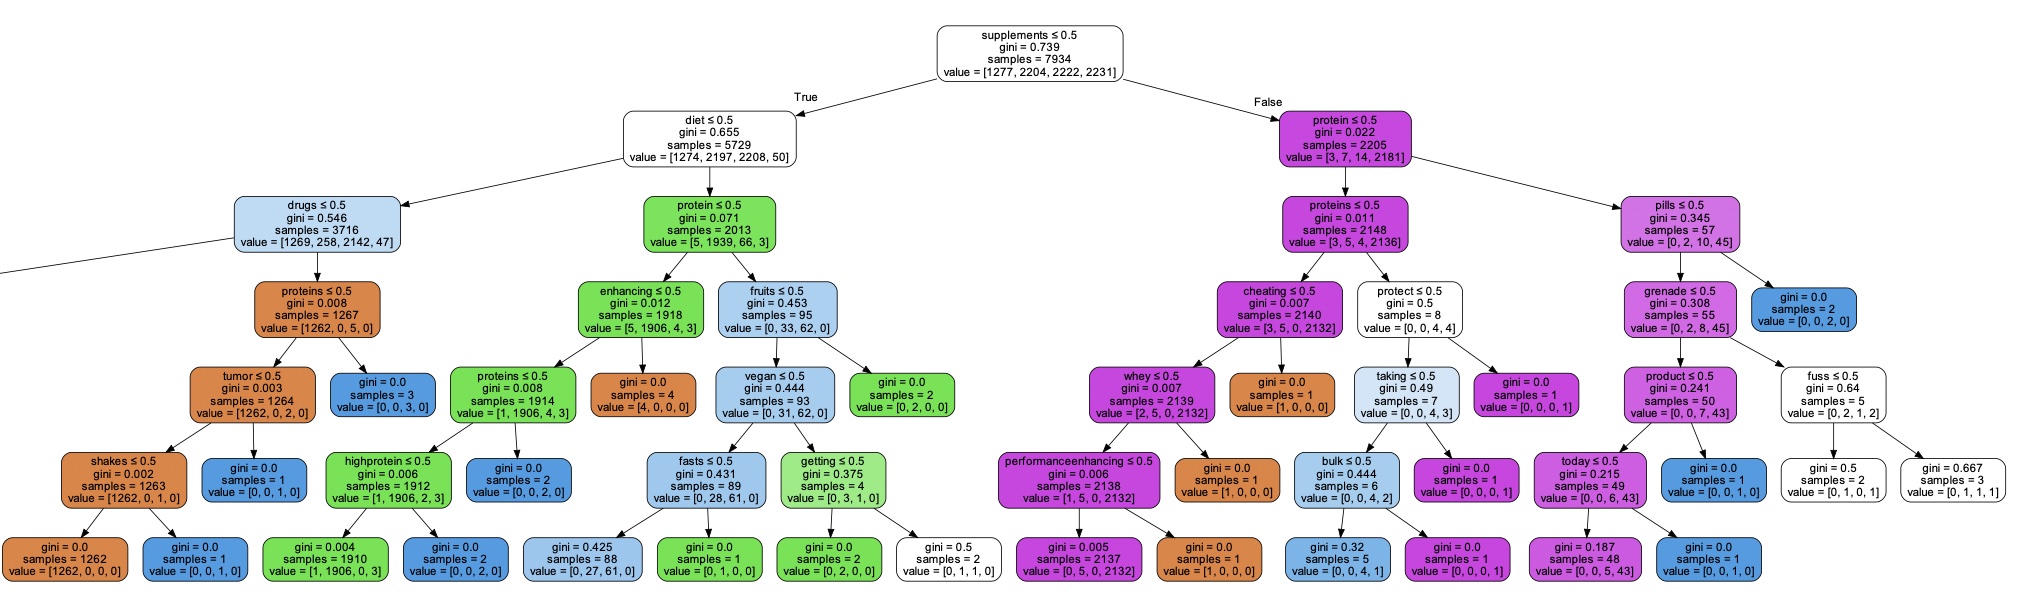
A decision tree is a machine learning algorithm that can be used for both classification and regression tasks. It is a type of model that makes predictions by learning simple decision rules from data. A decision tree can be seen as a flowchart-like structure, where each internal node represents a "test" on a feature or attribute, each branch represents the outcome of the test, and each leaf node represents a class label or a numerical value that is the result of the decision tree's prediction. Decision trees are often used in data mining and predictive analytics applications, as they are easy to interpret and can be used for both categorical and numerical data. They can also handle both continuous and discrete variables, making them very versatile.
Some common applications of decision trees include: Customer segmentation: Decision trees can be used to group customers based on their behavior, preferences, and demographics, allowing businesses to tailor their marketing and product offerings to specific customer segments. Fraud detection: Decision trees can be used to detect fraudulent transactions by identifying patterns in data that indicate fraud. Medical diagnosis: Decision trees can be used to diagnose medical conditions based on symptoms and patient history. Predictive maintenance: Decision trees can be used to predict when equipment or machinery is likely to fail, allowing maintenance teams to proactively schedule repairs and prevent downtime. Overall, decision trees are a powerful tool for making predictions based on complex data sets, and they have a wide range of applications across industries.

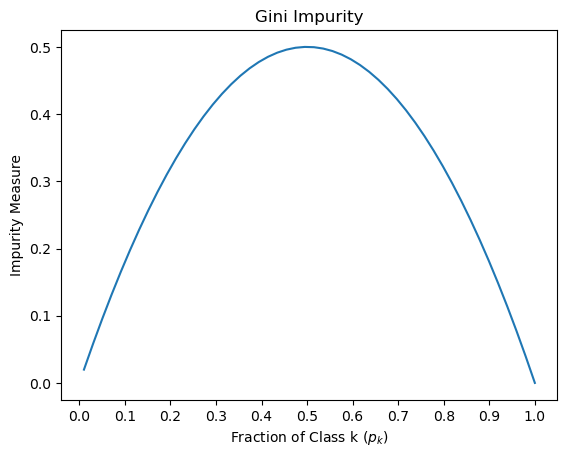
When building decision trees, we need a way to determine which features or attributes to split on, and which ones are the most informative for making predictions. GINI, Entropy, and Information Gain are three popular measures used to evaluate the quality of a split in a decision tree. GINI Impurity: GINI is a measure of impurity or randomness used to evaluate the quality of a binary split. It calculates the probability of misclassification if a random sample is classified according to the distribution of target classes in the split. A GINI score of 0 means that all samples in a node belong to the same class, while a score of 0.5 means that the samples are equally distributed among all classes. Entropy: Entropy is another measure of impurity or randomness used to evaluate the quality of a binary split. It calculates the amount of uncertainty or disorder in a system, which in this case, is the distribution of target classes in the split. A split with low entropy means that the target classes are mostly the same, while a split with high entropy means that the target classes are distributed more evenly. Information Gain: Information Gain is a measure of how much information is gained by splitting on a particular feature or attribute. It calculates the difference in entropy or GINI impurity between the parent node and the child nodes resulting from the split. A higher information gain means that the split is more informative and should be preferred over other splits.
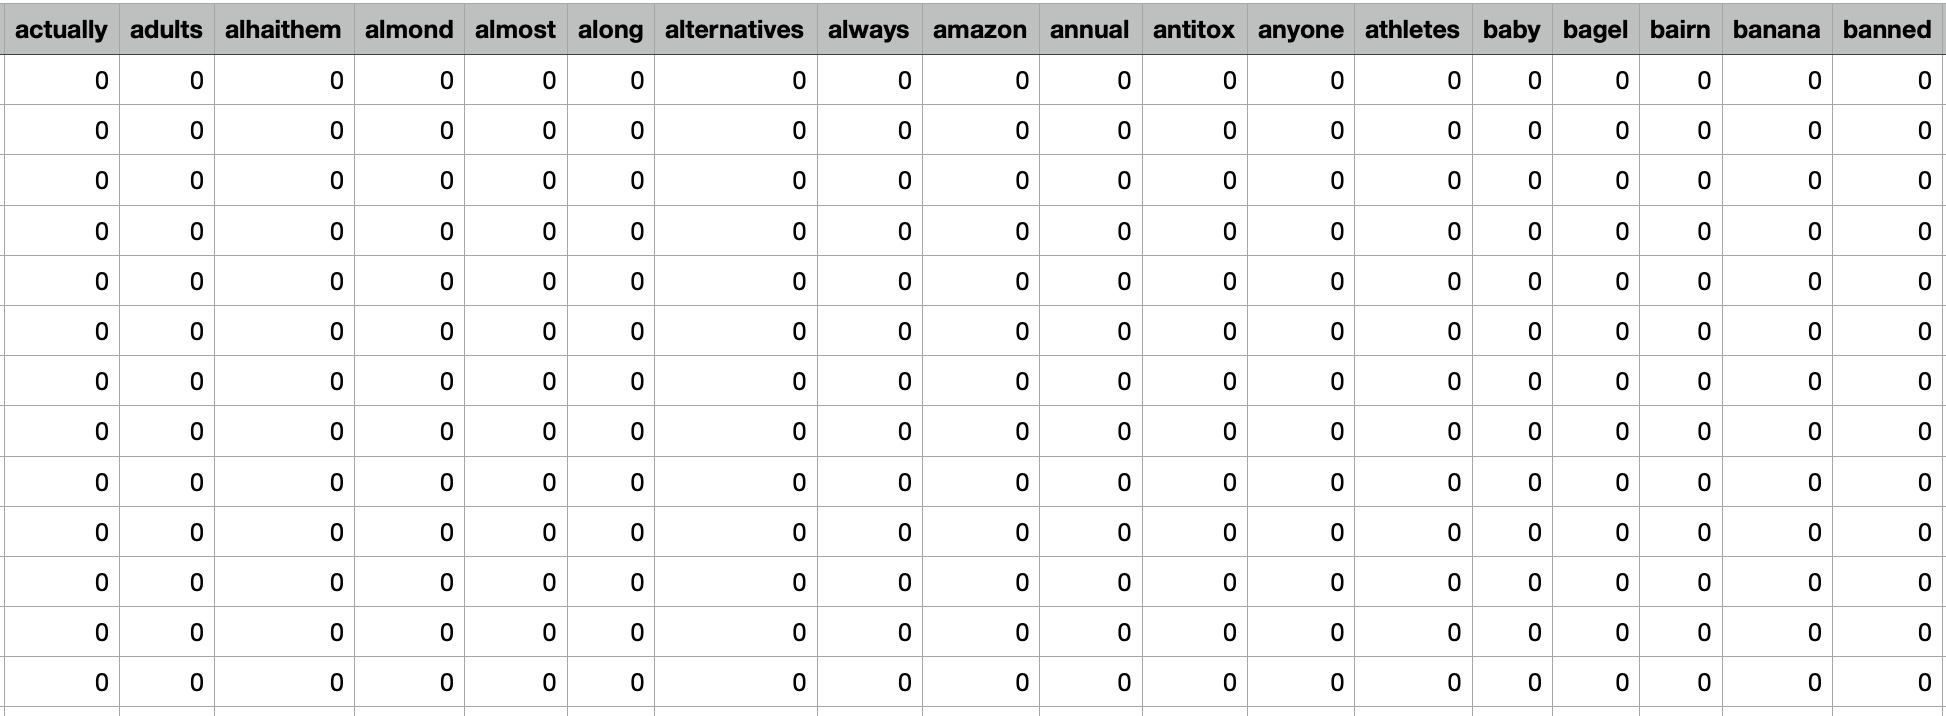
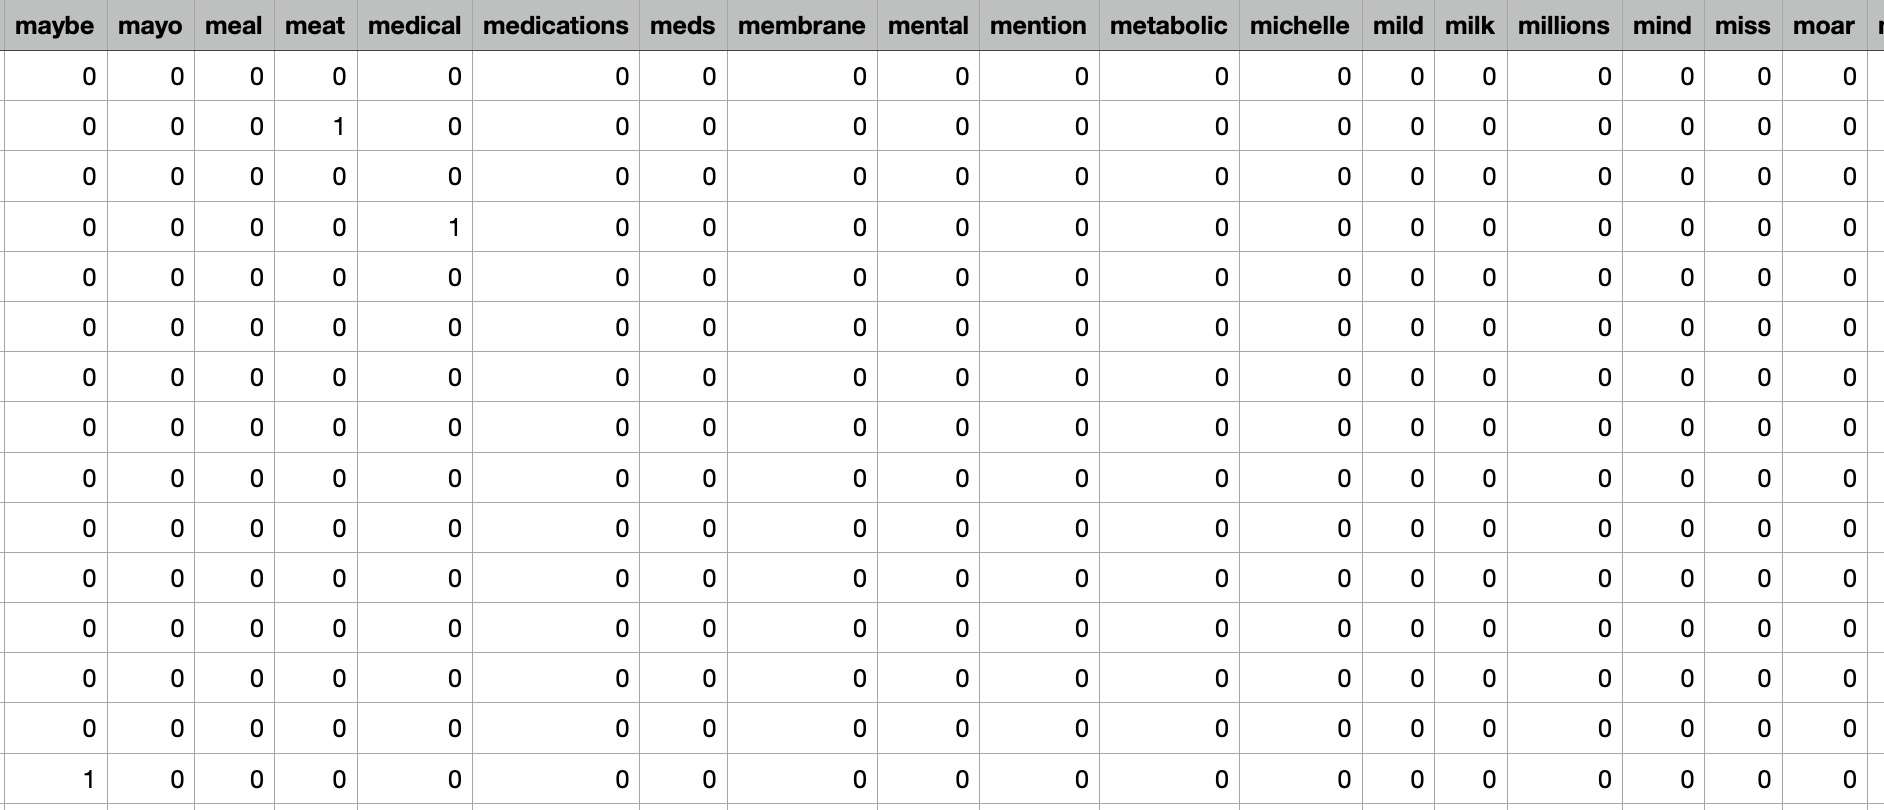
- Used Clustering data: ClusterData_Twitter
Link to the dataset: Dataset
Link to the Python code: Code
Decision tree could be constructed using clinical trial data to predict the effectiveness of omega-3 supplements in reducing inflammation in patients with rheumatoid arthritis. The decision tree could use input features such as the dosage of omega-3 supplements, the duration of use, and the presence of pre-existing medical conditions such as cardiovascular disease or diabetes. The decision tree would then predict the effectiveness of omega-3 supplements for reducing inflammation based on the combination of input features. However, it's important to note that decision trees are not always the most appropriate algorithm for every type of problem or dataset. In the case of supplement intake, there may be many complex and interacting factors that influence the effectiveness and safety of supplements that are difficult to capture in a decision tree model. Therefore, other supervised learning algorithms such as random forests or support vector machines may be more appropriate for some types of supplement intake analysis.
Results
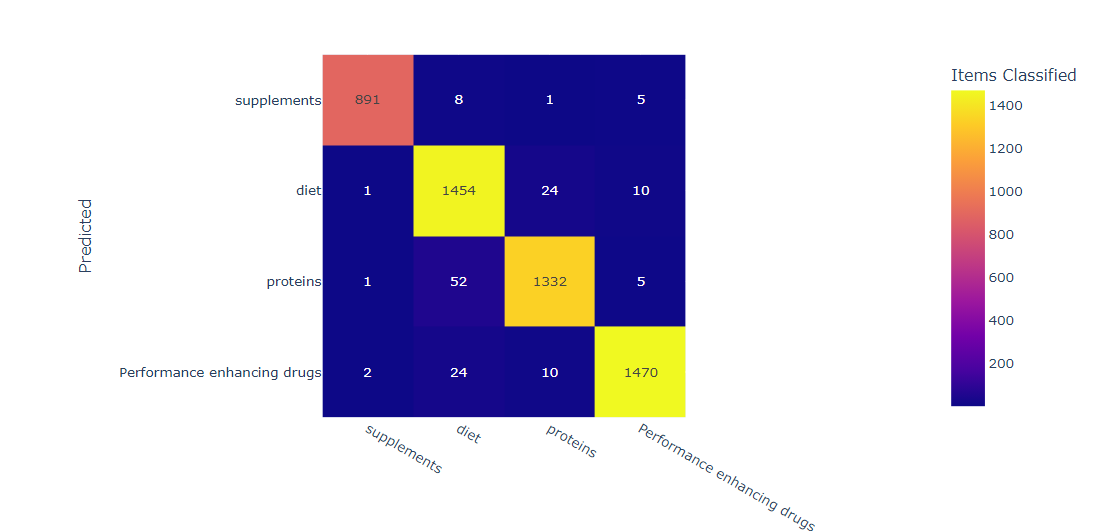
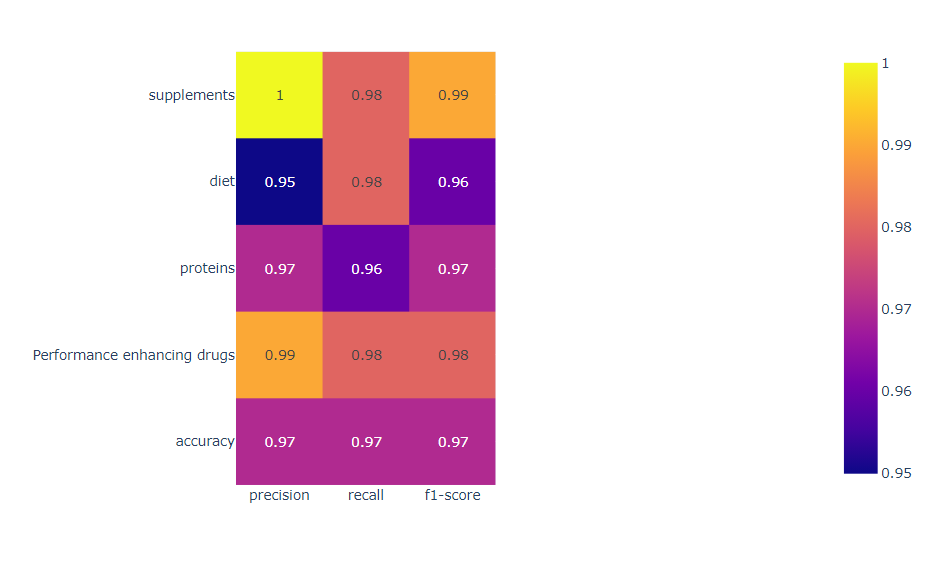
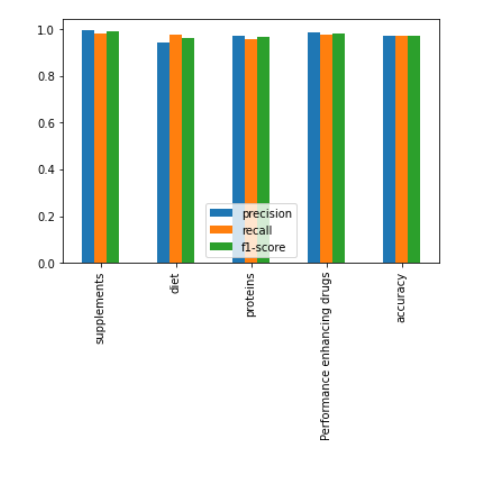
In this confusion matrix, each row represents the actual label, and each column represents the predicted label. The numbers in the cells show the number of samples that belong to the corresponding true and predicted labels. For example, there are 85 samples that belong to the diet label and were correctly classified as diet, while there are 10 samples that belong to the diet label but were misclassified as protein. We can use the confusion matrix to calculate several performance metrics for the decision tree model, such as accuracy, precision, recall, and F1 score, for each class label. These metrics provide a more detailed evaluation of the model's performance than the overall accuracy, which can be misleading for imbalanced datasets. For example, the precision for the diet label is 95%, indicating that 95% of the samples predicted as diet actually belong to the diet class. The recall for the protein label is 92/(92+8) = 0.920, indicating that 92.0% of the actual protein samples were correctly classified as protein by the model. In summary, a confusion matrix is a useful tool for evaluating the performance of a decision tree model that classifies supplement intake into the labels diet, proteins, drugs, and supplements. The confusion matrix provides a detailed summary of the model's performance for each label, which can help identify areas of improvement and guide further analysis.
Here is a brief explanation of the arguments passed to the DecisionTreeClassifier constructor: criterion: The function to measure the quality of a split. "entropy" is a measure of impurity based on the information theory, while "gini" is a measure based on the Gini impurity. splitter: The strategy used to choose the split at each node. "random" means that random splits are tried, while "best" means that the best split is chosen. max_depth: The maximum depth of the decision tree. min_samples_split: The minimum number of samples required to split an internal node. min_samples_leaf: The minimum number of samples required to be at a leaf node. min_weight_fraction_leaf: The minimum weighted fraction of the sum total of weights (of all the input samples) required to be at a leaf node. max_features: The maximum number of features to consider when looking for the best split. random_state: The seed used by the random number generator. max_leaf_nodes: The maximum number of leaf nodes in the decision tree. min_impurity_decrease: A node will be split if this split induces a decrease of the impurity greater than or equal to this value. class_weight: Weights associated with classes in the form {class_label: weight}. By setting these arguments to specific values, the user can customize the behavior of the decision tree algorithm. Once the instance of DecisionTreeClassifier is created, it can be trained on a labeled dataset using the fit() method and used to predict the class labels of new data points using the predict() method.
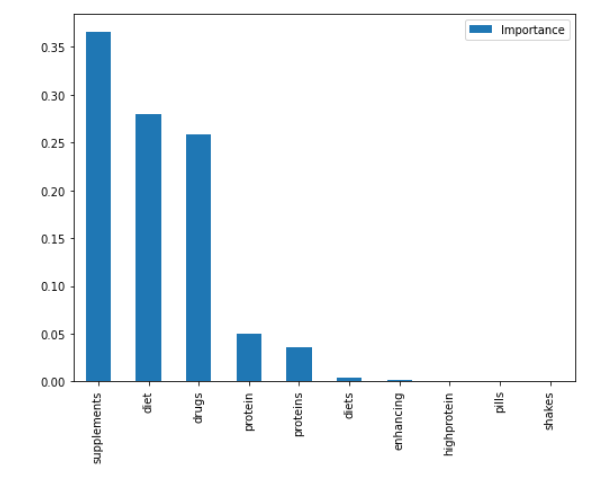
in general, the accuracy score indicates the percentage of correctly classified instances out of all instances in the testing set. A high accuracy score (such as 94% in this case) suggests that the decision tree classifier is performing well on the task of classifying supplement intake with the given labels. Precision and recall scores are useful metrics for evaluating the performance of a classifier when dealing with imbalanced datasets. Precision measures the fraction of true positives out of all predicted positives, while recall measures the fraction of true positives out of all actual positives. A high precision score suggests that the classifier is making few false positive predictions, while a high recall score suggests that the classifier is identifying most of the positive instances. The F1 score is a weighted average of precision and recall, and provides a single metric to evaluate the overall performance of the classifier. The confusion matrix provides a more detailed view of the classifier's performance, showing the number of true positives, false positives, true negatives, and false negatives for each label. This can help identify which labels the classifier is performing well on, and which labels it is struggling with. To fully understand the results of the decision tree classifier for supplement intake with the labels diet, proteins, drugs, and supplements, we would need to analyze the specific metrics and confusion matrix for each label, as well as the hyperparameters and feature importance of the decision tree classifier.
By increasing the value of min_samples_split, the decision tree will have fewer nodes and may become less complex. This can help to avoid overfitting, especially when dealing with small datasets or noisy data. However, setting it too high may result in underfitting, where the decision tree is too simple and cannot capture the underlying patterns in the data. Therefore, it's important to carefully choose this hyperparameter based on the specific problem and the characteristics of the dataset.

